
It’s been quite a year.
Every bit of our service has expanded: customer numbers, project numbers, number of buildings, analyses and hardware served. Thank you to everyone who has used the service and given us very useful feedback.
Based on that feedback, it’s time to make some changes to the webservice. Our aim here is to make it more intuitive and to add some extra features.
The changes will go live over the next couple of weeks, so let’s take a little tour:
1.Webservice layout
The most obvious difference is that we have moved the projects menu and the views menu up into the top bar. This frees up the full screen width for visualisations and analytics. To switch between projects or to add a project you now need to click on the drop down menu in the top bar.
Can’t see what you are looking for? The drop down menus support scrolling.

You’ll still be able to name the project and set it up in the project dialogue box (which you enter by clicking on the title of the project).
Similarly, if you want to set up a new analytics view, you click on the drop down menu and select the view you need. It will open in the main screen and you can add your kittens from your libary (the section with ‘Your Things’ at the top) or from other views.
2. Checking (and removing) kittens
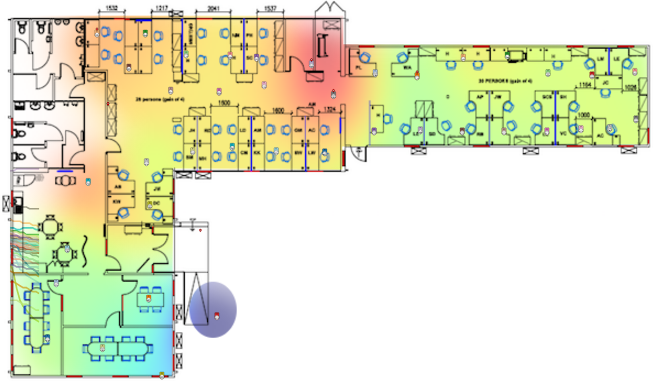
As before, if you have a kitten in your hand and want to know which one it is, you can squeeze its face and the kitten in the webservice will turn red:
BONUS TIP – for power users if you activate the magnet at the top right hand corner of each view, every time you squeeze a kitten it will add itself to the view.
Removing a kitten from a view is also simplified – when you pick up a kitten from within any view, a trash can will appear in the bottom right of your screen. You can drop kittens in them and they will disappear from the view you had selected them from. Note they will stay in all other views in the project, UNLESS you take them out of the project library view (at the top) and trash them. This will cause that kitten to disappear from all views in the project.
3. Scrolling through graphs
As well as making graphs much quicker to deliver information, we have activated a click and drag zoom to help zoom in and out on graph data. Here’s how it works: you place your mouse in the middle of a graph, click and drag either backwards (left) to zoom out, or forwards – right – to zoom in. The longer you drag for, the bigger your zoom.
4. Mean/max/min for graph views
For graph views, we have added ‘summary’: the ability to track the mean, max and minimum of any group of kittens over time. The feature can be turned on in the view dialogue box, which you get to by clicking on the view title.
Selecting ‘mean’ here produces this:
Helpful if you need to find out what the average performance across a zone is or track the impact of an improvement that affects many areas.
5. Project addressing
Projects and teams can both now hold address information. In future, this will allow your projects to be mapped in Google maps and potentially integrated with other localised information.
6. What’s next?
We will push these changes live in the next two weeks and look forward to your thoughts. And if you’d like to report problems or suggest improvements to performance, please do get in touch. We love to hear from you.