
WHAT
IS PURRMETRIX?
We help real estate professionals understand and benchmark building conditions – air quality, fabric performance and energy efficiency, using our award winning sensors and web service.
Whether you want an off the shelf set of tools or a fully managed service we have a solutions that are scaleable, robust and which won’t generate nasty pricing surprises.
- SENSORS
- NETWORK
- WEB SERVICES
- API
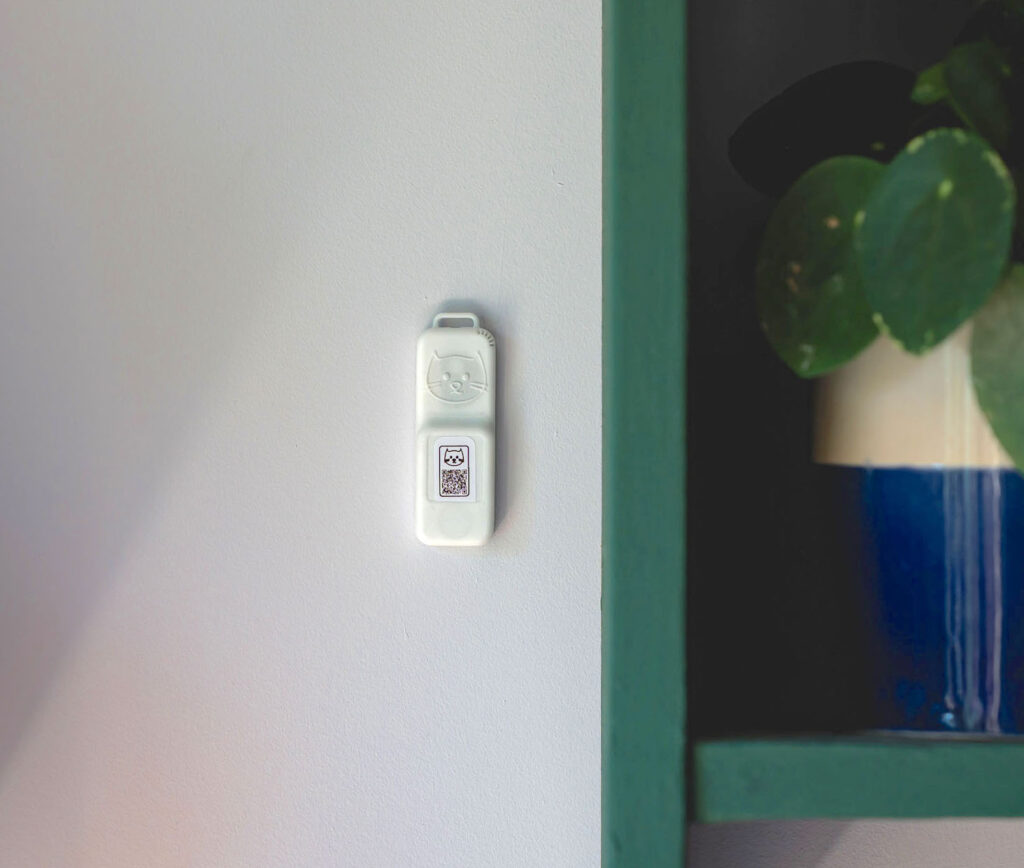
SENSORS
Supporting a wide range of best in class environmental sensors for temperature, humidity, CO2, light and movement. All Purrmetrix sensors are accurate, long life cycle and easy to retrofit.
Installation is quick, straightforward and easy to scale by simply adding more sensors to the building where and when they are needed.
Our built in integrations also allow collection of data from other devices such as smart meters.
WORKING WITH PURRMETRIX
Purrmetrix tools can be purchased as standard toolkits (Warmscore) for housing or a custom package (Purrmetrix Pro) for larger and more complex deployments.
We can provide training and support in installation, configuring and analysing data.
Our mission is to make data collection and analysis a simple, normal part of every decision about operating and upgrading housing. To provide tools that all professionals – designers, surveyors, installers and managers – will find easy to use.
NETWORK
With Purrmetrix there is no need for a local network connection – we can operate as a standalone network within any building.
Easy to set up, using GSM and proprietary networks, the gateway works out of the box to connect multiple sensors to the cloud in a secure, real time network.
Data integrity is protected using enterprise level security and the data is passed to Purrmetrix’s cloud for optimisation and analysis.

WORKING WITH PURRMETRIX
Purrmetrix tools can be purchased as standard toolkits (Warmscore) for housing or a custom package (Purrmetrix Pro) for larger and more complex deployments.
We can provide training and support in installation, configuring and analysing data.
Our mission is to make data collection and analysis a simple, normal part of every decision about operating and upgrading housing. To provide tools that all professionals – designers, surveyors, installers and managers – will find easy to use.
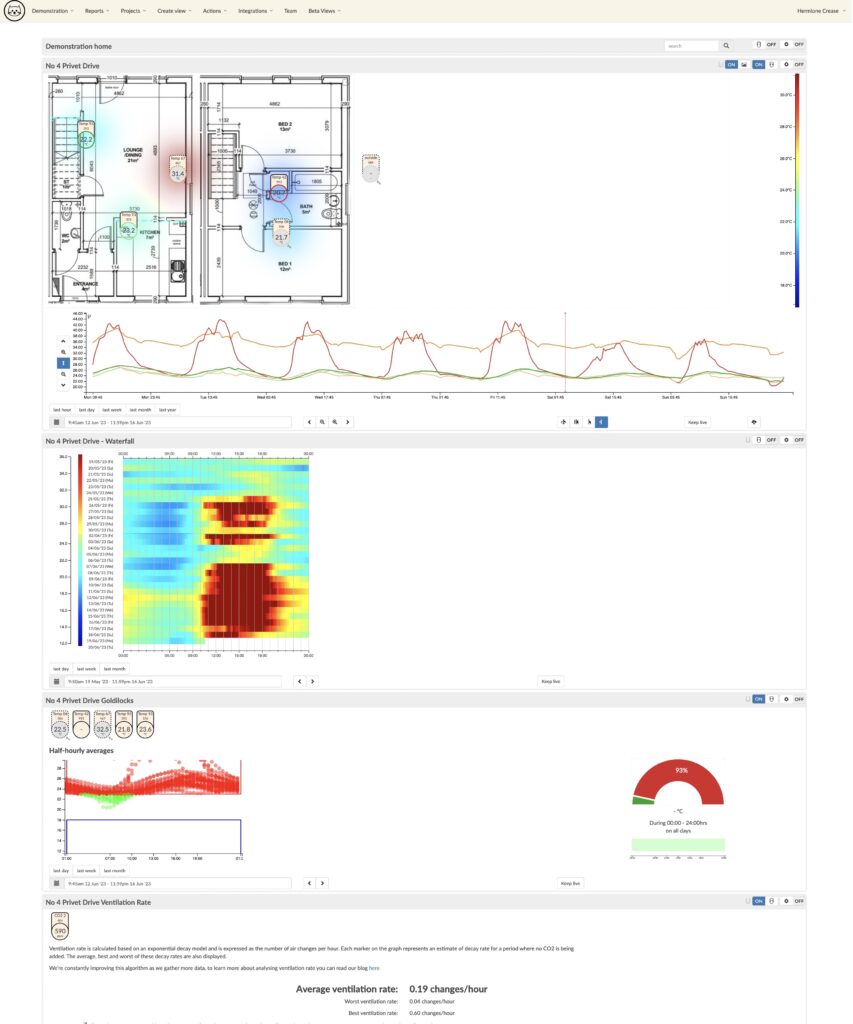
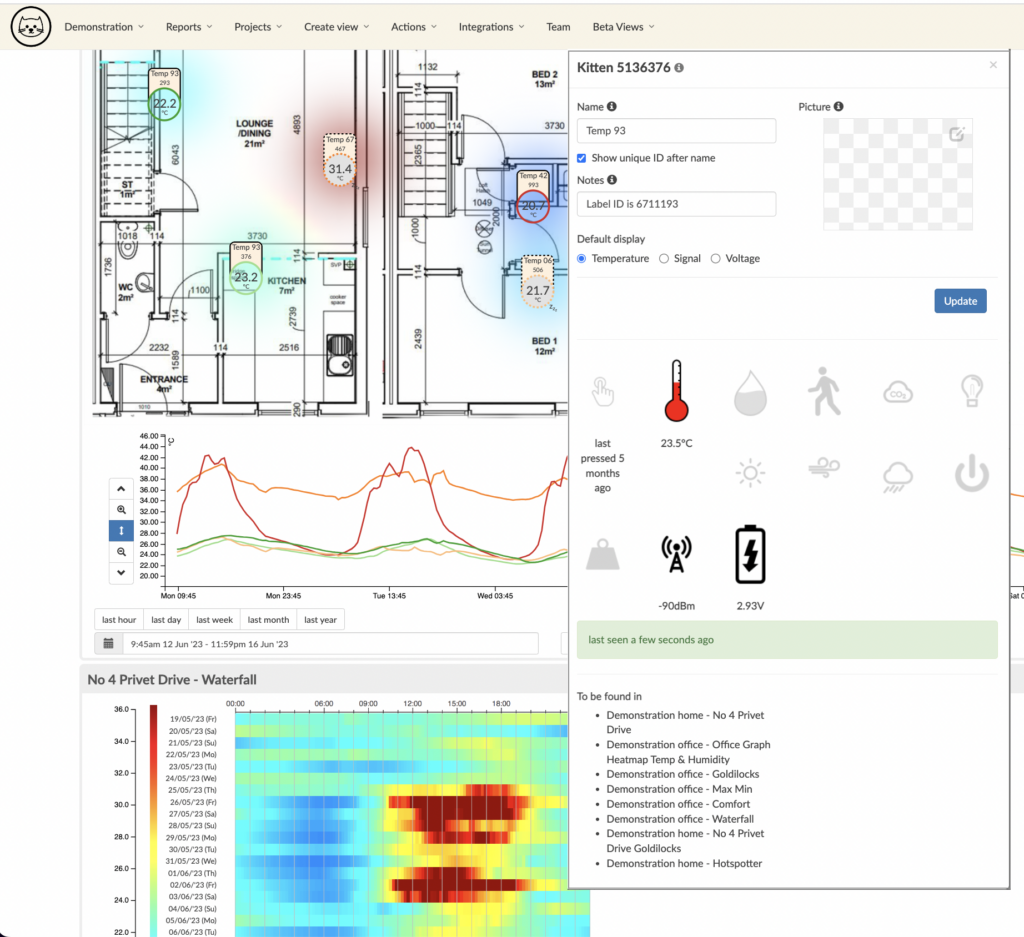
WEB SERVICES
A scaleable solution that allows you to monitor multiple sensors and turn the data into powerful analytics. Using the Purrmetrix platform it is possible to set sophisticated alerts, visualise conditions across the estate and apply powerful analytics to look at
- Air quality and ventilation rates – where and when poor conditions happen
- Fabric performance – heat loss from a building and condensation / mould risks
- Comfort delivered (temperature, humidity, CO2). Where and when you see outliers
- Energy efficiency measurement and verification.
WORKING WITH PURRMETRIX
Purrmetrix tools can be purchased as standard toolkits (Warmscore) for housing or a custom package (Purrmetrix Pro) for larger and more complex deployments.
We provide training and support in installation, configuring and analysing data.
Our mission is to make data collection and analysis a simple, normal part of every decision about operating and upgrading housing. To provide tools that all professionals – designers, surveyors, installers and managers – will find easy to use.
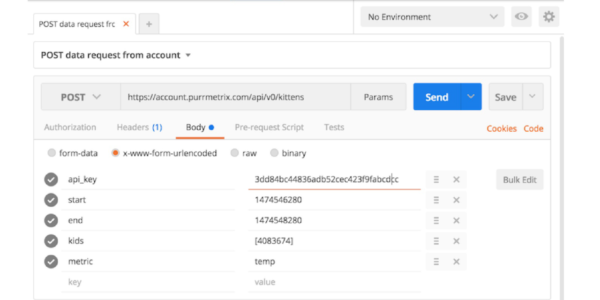
API
A full set of developer’s tools and support allows data streams from the Purrmetrix service to be integrated into any of your other cloud based platforms. The applications are endless – building automation, occupier dashboards, integrations with CAFMs, bespoke reports.
We will support your developers or you can work with the Purrmetrix team to create a bespoke integration for your particular requirements.
Our service also has a wide range of pre-built integrations. So you can start with Purrmetrix environmental sensors and extend by integrating data from meters and other sensors into one analytics and management portal.
WORKING WITH PURRMETRIX
Purrmetrix tools can be purchased as standard toolkits (Warmscore) for housing or a custom package (Purrmetrix Pro) for larger and more complex deployments.
We can provide training and support in installation, configuring and analysing data.
Our mission is to make data collection and analysis a simple, normal part of every decision about operating and upgrading housing. To provide tools that all professionals – designers, surveyors, installers and managers – will find easy to use.