
What you need to know before you start condensation monitoring (with examples!)
It looks like a bumper year for condensation claims. As the second lock down and social restrictions increase the number of hours families spend at home, humidity levels in housing are soaring.
As any school kid can tell you, human beings are 60% water, and the spaces we occupy have to be able to dispose of the water we give off. Getting this done effectively is helped by a warm environment, but the COVID crisis means many tenants are finding their incomes reduced, putting pressure on their budgets for heating. Colder homes, occupied for longer, are a recipe for condensation and mould growth.
Condensation is a classic example of the sort of problem that if caught early and treated correctly will cost a lot less than if left undetected. It is also the problem that most frequently causes a breakdown in landlord tenant relationships, as tenant’s behaviour is often a significant contributing factor. And no-one takes kindly to being told they are part of the problem. So early detection of a condensation problem, before mould gets into the fabric, is important to trigger an action plan and keep everyone happy.
Many RSLs have been looking at pilot projects based on RH measurements to help pick up on early warning signs of condensation. If you’re in this situation, we’ve dug back through our data to give you a short guide on what you need to look for to make a success of condensation monitoring. What is best practise to get the most accurate results? What are the metrics you might look for? What can you do with this data?
Some basic physics
Wikipedia tells us that relative humidity (RH) is the ratio of the partial pressure of water vapor to the equilibrium vapor pressure of water at a given temperature. Well, thanks Wikipedia.
In practise what this means is that RH is an expression of the air’s capacity to hold water vapour at a given temperature. Air can hold a lot more water vapour at a high temperature than at a low temperature, which is why we end up with water condensing when warm air hits a cold surface.
This means you can have a lot less water floating around in the air of a room that is 17°c with an RH of 70% than in a room which is 22°c with an RH of 50%. So the first thing to note is that simple RH %ages can be a bit misleading when it comes to measuring condensation risk.
If you take your 24°c room and keep the same amount of water, then as you reduce the temperature the RH will rise, and the point at which it becomes 100% (ie the point at which condensation occurs) is the dew point. In this case, with 50% humidity the dew point would be about 11°c.
The third metric worth knowing is the actual vapour density, that is the weight of water in the air. If you can get it, this is one of the most useful metrics to watch in condensation analysis because it’s the measure of how much water occupants are putting into the home.
RH is not the only game in town.
We’re focussing on the physics here because it is our belief that many landlords are missing valuable information by focussing on RH alone. Instead, running analysis on dew point and weight of water uncovers information that is richer and more accurate, allowing interventions to be better targeted. For example, here is a side by side comparison of two homes both of which have a serious RH problem, with measurements regularly in the 80% plus zone:
Take that data and turn it into dew point and you can really see which house has the problem. Here the black line is the real temperature, and the blue line is the dew point (when condensation occurs). House A is spending significantly more time at or below dew point, and is undoubtedly wringing wet. The other house has occasional incidents.
How to gather effective condensation data.
For any monitoring project two key questions are: where do you measure and how long do you measure.
I probably don’t need to spell this out, but if you’re looking for condensation problems using RH data, take measurements where you expect problems to appear. External walls, close to corners, in heavily occupied rooms are generally a good bet.
However, to gather enough data to think about all the root causes, you are very likely to need more than one sensor. Measuring conditions in bathroom and kitchen will help confirm if ventilation is working correctly, a sensor closer to the most used heater will confirm patterns of heating use.
Bear in mind that you need to look at the behaviour of the home with a variety of weather conditions and occupant behaviours – so plan for 3-4 weeks of monitoring.
How do I make sense of all this data?
If you’ve confirmed using dew point analysis that you’ve got a serious condensation problem, the obvious next question is what is causing that?
Condensation problems are generally the result of a combination of problems. To get condensation you need 1) a source of water vapour (hello humans!) 2) a cold surface and 3) air that isn’t able to circulate effectively to remove the water vapour, either because it is too cold or because it’s not being removed from the building.
Most condensation problems can be placed somewhere on this space:
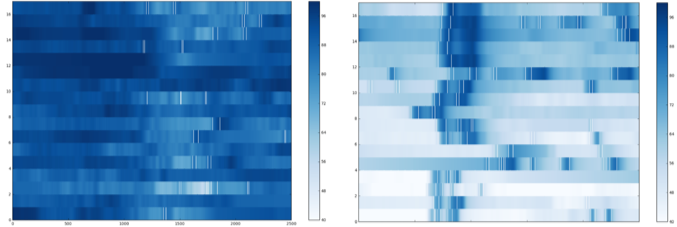
Deciding where you are on this triangle will help define the action you need to take. By looking at weight of water in the house and mapping it over a week’s use it is easy to pick up the contribution from lifestyle.
For example here we have footprints from two homes – each row is 24 hours of data. One house has a significant high base level of humidity and the other has a pattern that clearly shows morning showers. Of course, neither of these are a problem in themselves, unless the dew point vs temperature analysis shows high risk of condensation.
More heating is often mentioned as a solution to condensation. This works by 1) raising the temperature of the cold surfaces in the home and 2) allowing the air to hold more water vapour so it can be removed from the home better, if the ventilation is working.
Condensation is commonest on external walls, so it’s important to consider, before asking tenants to run their heating for longer, whether the fabric of the home is losing heat too fast. A home with walls or ceilings cold from heatloss will be very difficult to heat sufficiently to avoid condensation (as an easy example, it’s nearly impossible to heat a bedroom sufficiently to avoid condensation on single glazed windows on a cold morning). We will be writing more on how to gather information on heatloss shortly, so keep checking back in.
If heating is adequate to mobilise the water vapour then the final part of the jigsaw to look at is ventilation. The simplest approach is to look at the time taken to reduce water vapour to normal levels after an event like a shower. The chart below gives a few examples of ‘natural’ and ‘artificial’ ventilation in an older house, showing what happens after cooking and showering.
Analysed correctly, RH readings are a rich source of information that can not only confirm the extent of condensation, but also predict where problems are likely to occur and demonstrate how to tackle them. Purrmetrix provides easy to use, powerful tools for measuring and analysing condensation and RH problems in any home – if you have a problem with condensation that would benefit from diagnostic monitoring, contact us for a demo or more information.